
In 2015, the global leaders of governments and businesses including Shell and BP congregated to sign the landmark Paris Climate Agreement. While most of the attention on sustainability revolves around corporate commitments to climate change and driving positive business results, we focus on the sustainability of the supply chains of both companies. Why? For global enterprises, the supply chain has been the most effective channel for enacting change and accelerating progress.
The data on a company’s sustainability and corporate social responsibility scores are sourced from CSRHub, an industry-standard rating system. Companies are scored on a scale from 0 to 100 (100=positive rating).
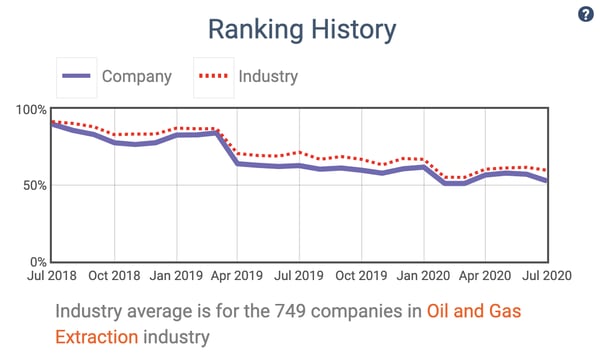
The current sustainability rating for BP is 53 and for Shell it’s 54
Figure 1 shows the trend of BP’s rating benchmarked against the industry overtime. As you can see BP has consistently performed either inline or just under the industry. The downward trends also indicate that the direction of both BP and the industry is not heading towards their sustainable target.
Figure 1: BP ESG time-series evolution
Next, we expanded our analysis to explore BP’s supply chain sustainability. Using Inferess dataset that maps out economic linkages between companies at a global scale, we obtained ESG ratings for each individual company on BP’s supply chain. Figure 2 shows a simplified view of BP's supply chain and Figure 3 shows their sustainability ratings.
Figure 2: BP Supply Chain Map
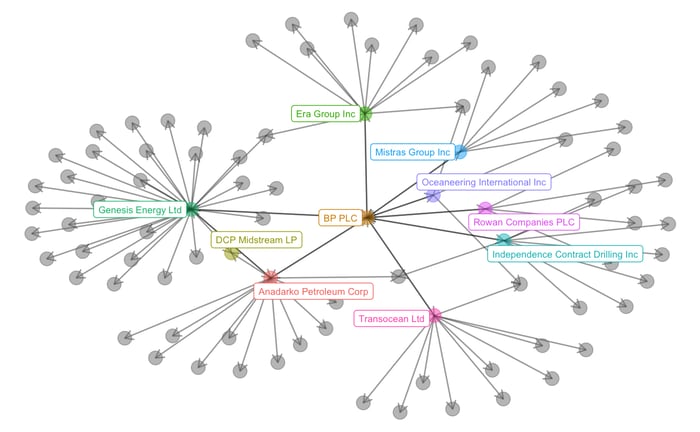
Figure 3: Sustainability Ratings of BP's First Degree Connections
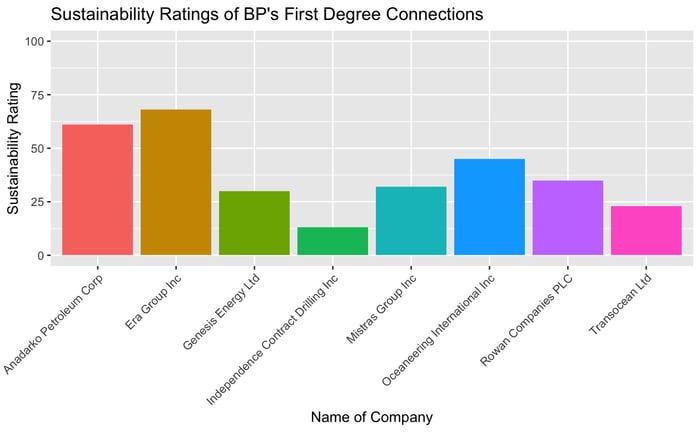
The results show that BP on the 1st-tier relationships boast a more sustainable supply chain than Shell
| Metric | BP | Shell | Difference between BP and Shell |
| Minimum | 13.00 | 5.00 | 8.00 |
| Maximum | 68.00 | 40.00 | 28.00 |
| Mean | 38.38 | 21.20 | 17.18 |
| Median | 33.50 | 22.00 | 11.50 |
This is particularly true because of the impact of Era Group Inc, which has an ESG rating of 68.00. Indicating that wittingly or unwittingly, BP’s supply chain players on the first tier are more closely in line with their sustainability goals.
Figure 4 digs deeper into the sustainability of BP’s 2nd and 3rd-tier relationships, and the comparison results indicate an almost identical rating system for both BP and Shell on the 2nd and 3rd-tier.
Figure 4: Sustainability Ratings of BP's Second and Third Degree Connections
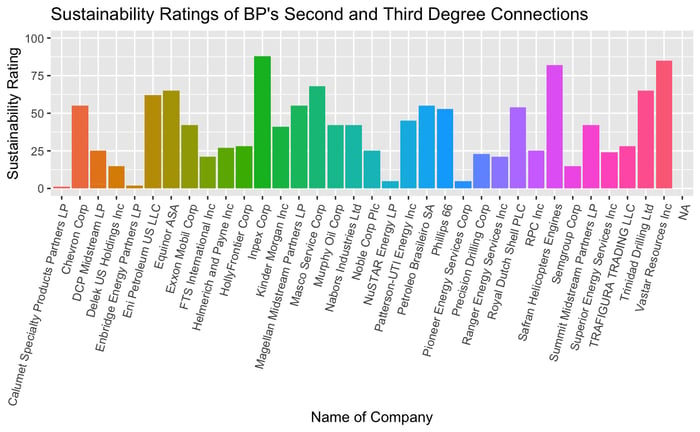
| Metric | BP | Shell | Difference between BP and Shell |
| Minimum | 1.00 | 2.00 | -1.00 |
| Maximum | 88.00 | 79.00 | 9.00 |
| Mean | 38.03 | 38.65 | -0.62 |
| Median | 41.00 | 40.50 | 0.5 |
The result shows that although 1st-tier relationships were quite divergent, the supply chain sustainability of both BP and Shell somewhat converges when more players are considered.
Sustainable supply chain practices can help companies tackle global challenges such as climate change, diminishing natural resources, modern slavery and more – all of which will require assessment and continuously monitoring of sustainability performance across the full spectrum of diverse supply chain.
Using the Inferess global supply chain data, we compared the sustainability of BP and Shell across different tiers of their supply chain. BP certainly has a greener supply chain in the first degree, however, both firms reverted to more expected performances in the 2nd and 3rd tiers. This indicates that to achieve the lofty ambitions of meeting the Paris Climate Agreement standards, both firms need to relook the players in their supply chain to ensure that their values and message are aligned.
Want to learn more? Contact us to book a free demo and consultation